function echart01() {
var myChart = echarts.init(document.getElementById('Visitors'), null, { renderer: 'svg' });
var option;
option = {
title: {
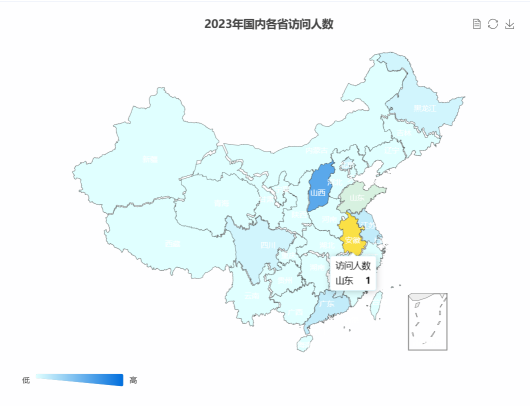
text: '2023年国内各省访问人数',
left: 'center'
},
visualMap: {
min: 0,
max: 15,
left: 'left',
top: 'bottom',
text: ['高', '低'],
calculable: false,
orient: 'horizontal',
inRange: {
color: ['#e0ffff', '#006edd'],
symbolSize: [30, 100]
}
},
toolbox: {
show: true,
feature: {
mark: { show: true },
dataView: { show: true, readOnly: false },
magicType: {
show: true,
type: ['pie', 'funnel']
},
restore: { show: true },
saveAsImage: { show: true }
}
},
tooltip: {
padding: 8,
enterable: true,
transitionDuration: 1,
textStyle: {
color: '#000000',
decoration: 'none'
},
formatter: function (params) {
var name = params.name;
var value = params.value;
var tipData = params.data.tipData;
var customContent = '<div>' +
'<span style="color: black">' + name + '</span>' +
'<br />' +
'<span style="color: black">' + 'IP数' + '</span>' +
'<span style="color: black; margin-left: 8px">' + value + '</span>' +
'<br />' +
'<span style="color: black">PV数:</span>' +
'<span style="color: black; margin-left: 8px">' + tipData[0] + '</span>' +
'<br />' +
'<span style="color: black">UV数:</span>' +
'<span style="color: black; margin-left: 8px">' + tipData[1] + '</span>' +
'</div>';
return customContent;
}
},
series: [
{
name: '访问人数',
type: 'map',
mapType: 'china',
itemStyle: {
normal: {
label: {
show: false
}
},
emphasis: {
label: {
show: true
}
}
},
label: {
normal: {
show: true,
textStyle: {
color: '#fff',
fontSize: 12
}
},
emphasis: {
color: '#fff'
}
},
data: [
{
name: '北京',
value: 4,
tipData: [
5,
3
]
},
{
name: '天津',
value: 0,
tipData: [
0,
0
]
},
{
name: '上海',
value: 2,
tipData: [
3,
2
]
},
{
name: '重庆',
value: 1,
tipData: [
2,
1
]
},
{
name: '河北',
value: 1,
tipData: [
1,
1
]
},
{
name: '河南',
value: 2,
tipData: [
5,
2
]
},
{
name: '云南',
value: 0,
tipData: [
0,
0
]
},
{
name: '辽宁',
value: 0,
tipData: [
0,
0
]
},
{
name: '黑龙江',
value: 1,
tipData: [
5,
1
]
},
{
name: '湖南',
value: 0,
tipData: [
0,
0
]
},
{
name: '安徽',
value: 2,
tipData: [
4,
2
]
},
{
name: '山东',
value: 1,
tipData: [
1,
1
]
},
{
name: '新疆',
value: 0,
tipData: [
0,
0
]
},
{
name: '江苏',
value: 2,
tipData: [
2,
2
]
},
{
name: '浙江',
value: 0,
tipData: [
0,
0
]
},
{
name: '江西',
value: 2,
tipData: [
3,
2
]
},
{
name: '湖北',
value: 0,
tipData: [
0,
0
]
},
{
name: '广西',
value: 1,
tipData: [
1,
1
]
},
{
name: '甘肃',
value: 0,
tipData: [
0,
0
]
},
{
name: '山西',
value: 7,
tipData: [
77,
14
]
},
{
name: '内蒙古',
value: 0,
tipData: [
0,
0
]
},
{
name: '陕西',
value: 0,
tipData: [
0,
0
]
},
{
name: '吉林',
value: 0,
tipData: [
0,
0
]
},
{
name: '福建',
value: 0,
tipData: [
0,
0
]
},
{
name: '贵州',
value: 0,
tipData: [
0,
0
]
},
{
name: '广东',
value: 6,
tipData: [
10,
5
]
},
{
name: '青海',
value: 0,
tipData: [
0,
0
]
},
{
name: '西藏',
value: 0,
tipData: [
0,
0
]
},
{
name: '四川',
value: 1,
tipData: [
2,
1
]
},
{
name: '宁夏',
value: 0,
tipData: [
0,
0
]
},
{
name: '海南',
value: 0,
tipData: [
0,
0
]
},
{
name: '台湾',
value: 0,
tipData: [
0,
0
]
},
{
name: '香港',
value: 0,
tipData: [
0,
0
]
},
{
name: '澳门',
value: 0,
tipData: [
0,
0
]
}
]
}
]
};
var count = 0;
var timeTicket = null;
var dataLength = option.series[0].data.length;
timeTicket && clearInterval(timeTicket);
timeTicket = setInterval(function () {
myChart.dispatchAction({
type: 'downplay',
seriesIndex: 0
});
myChart.dispatchAction({
type: 'highlight',
seriesIndex: 0,
dataIndex: count % dataLength
});
myChart.dispatchAction({
type: 'showTip',
seriesIndex: 0,
dataIndex: count % dataLength
});
count++;
}, 1000);
myChart.on('mouseover', function (params) {
console.log(params);
clearInterval(timeTicket);
myChart.dispatchAction({
type: 'downplay',
seriesIndex: 0
});
myChart.dispatchAction({
type: 'highlight',
seriesIndex: 0,
dataIndex: params.dataIndex
});
myChart.dispatchAction({
type: 'showTip',
seriesIndex: 0,
dataIndex: params.dataIndex
});
});
myChart.on('mouseout', function (params) {
timeTicket && clearInterval(timeTicket);
timeTicket = setInterval(function () {
myChart.dispatchAction({
type: 'downplay',
seriesIndex: 0
});
myChart.dispatchAction({
type: 'highlight',
seriesIndex: 0,
dataIndex: count % dataLength
});
myChart.dispatchAction({
type: 'showTip',
seriesIndex: 0,
dataIndex: count % dataLength
});
count++;
}, 1000);
});
if (option && typeof option === 'object') {
myChart.setOption(option);
}
window.addEventListener('resize', myChart.resize);
}
|